

Gold trades near $4,700 per ounce. Silver trades near $74. This creates a gold to silver ratio of approximately 63:1, meaning it takes 63 ounces of silver to equal the value of one ounce of gold. Historically, this ratio has been a powerful mean reverting indicator: when it stretches too wide, silver tends to outperform gold on a percentage basis in subsequent years as the ratio compresses back toward its long term average. With silver down 44% from its all time high while gold pushes toward record territory, and with a sixth consecutive supply deficit deepening in the silver market, the current ratio presents retirement investors with a rare opportunity to accumulate the white metal at valuations that have historically preceded explosive relative performance.
Understanding the Ratio
The gold to silver ratio is calculated by dividing the gold price by the silver price. A ratio of 63:1 means gold is 63 times more expensive than silver per ounce. Historically, this ratio has fluctuated widely, from as low as 15:1 during certain periods to as high as 120:1 during the COVID panic in March 2020. The long term average over the past century is approximately 50:1 to 60:1. When the ratio climbs above 70 or 80, it typically signals silver is undervalued relative to gold. When it falls below 40, it suggests silver may be overvalued. At 63:1, the ratio sits near the upper end of its historical range, indicating silver has lagged gold's rally and may be poised for catch up performance.
Why Silver Has Lagged
Silver's underperformance relative to gold in the current cycle is driven by several factors. First, silver has higher volatility and tends to lag at the beginning of precious metals bull markets before catching up explosively later. Second, industrial demand for silver declined slightly in 2025 and is forecast to drop 3% in 2026 to around 640 million ounces as some sectors face economic headwinds. Third, speculative positioning in silver futures became overly extended in early 2026 when prices briefly touched $120, triggering a sharp correction as speculators exited. Fourth, jewelry consumption fell 9% year over year in 2026 due to record high prices curbing demand. These are cyclical headwinds, not structural impediments, and they create the exact conditions under which disciplined long term investors accumulate.
The Bull Case for Silver Outperformance
Despite near term industrial softness, the structural case for silver remains overwhelmingly bullish. The silver market is experiencing its sixth consecutive year of supply deficit, with 67 million ounces of shortfall in 2025 and a projected 46.3 million ounce deficit in 2026. Cumulative stock draws since 2021 total 762 million ounces. Unlike gold, silver has massive industrial applications in solar panels, electric vehicles, 5G infrastructure, and AI data centers, all of which are secular growth markets. Investment demand for silver bars and coins is projected to surge 18% in 2026 as retail investors belatedly recognize the opportunity. Bank of America's bull case scenario targets $135 to $309 per ounce if physical shortages intensify. Historically, silver has delivered 2x to 3x gold's percentage gains during precious metals bull markets once it catches fire.
Mean Reversion Dynamics
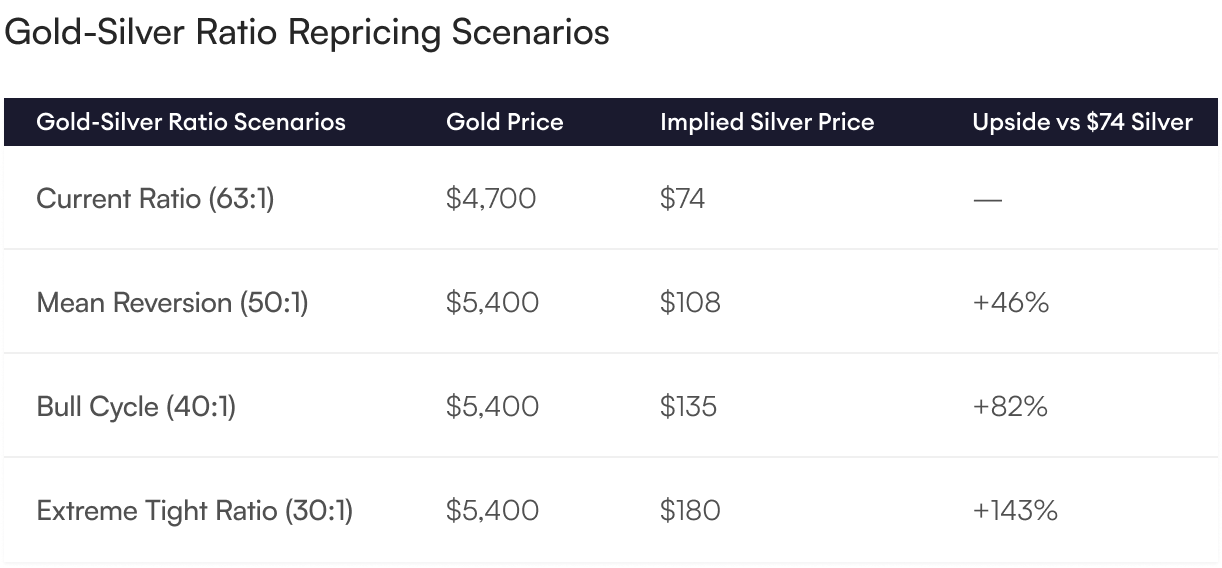
Markets revert to mean. The gold to silver ratio is no exception. When the ratio reached 120:1 in March 2020, silver subsequently rallied from $12 to nearly $30 over the following year, compressing the ratio dramatically. When the ratio was around 80:1 in 2016, silver delivered explosive performance in 2020 and 2021. At 63:1 today, the ratio is not at an extreme, but it is elevated enough to suggest that silver is undervalued on a relative basis. If the ratio compresses back toward 50:1, and gold continues rising toward $5,400 as Goldman Sachs projects, the mathematical implication is silver trading above $100 per ounce. If the ratio compresses further toward 40:1 in a full bull market scenario, silver could reach $135 or higher even if gold only modestly exceeds current forecasts.
Dual Demand Drivers
Silver is unique among precious metals in that it serves both as a monetary asset and an industrial commodity. This dual role creates powerful demand dynamics. When investors seek inflation protection and safe haven exposure, they buy silver alongside gold. When the global economy accelerates green energy adoption, electrification, and digitalization, industrial users consume silver at structural rates that exceed mine supply. No other metal combines these two demand drivers at scale. Gold is almost entirely monetary. Copper is almost entirely industrial. Silver bridges both, and in a world of persistent inflation and accelerating energy transition, that positioning is extraordinarily bullish.
Leverage Your Precious Metals Allocation
Retirement investors who already own gold or are considering an initial precious metals allocation should pay close attention to the gold to silver ratio. A 63:1 ratio suggests that adding silver to a portfolio offers asymmetric upside: if the ratio compresses toward historical norms, silver will outperform gold on a percentage basis, amplifying portfolio returns. If gold and silver both rise together, the diversification benefits remain intact. Silver's sixth consecutive supply deficit, structural industrial demand, and historic valuation discount relative to gold create a compelling case for meaningful silver exposure alongside core gold holdings. Contact Merchant Gold Group today to learn how to structure a precious metals IRA that captures both the stability of gold and the explosive leverage of silver at a historically attractive gold to silver ratio.


